Using Query Monitor to Improve WordPress Pagespeed

Hello, readers! I wanted to share a personal experience, as well as a real case for optimizing the speed of your WordPress site. Here’s what happened and how I managed to solve the issue.
I was approached by a client who had a website for the sale and rental of real estate. He didn’t use the site actively and for a long time he had about 100 properties listed on the site.
The site worked quickly and its work suited the client. But then he decided to add the automatic import of properties to his site from a cloud service.
As a result, there were about 20,000 real estate properties on the site, and each object had about 200 fields (floor, number of rooms, price, address, etc.), which exceeded 4,000,000 rows in one of the WP DB tables.
At the same time, the work of the site slowed down 60-100 times. The main page with property listings would load for about 30 seconds … and filtering results sometimes just put the site on the blades.
Failed attempts to solve the problem
We tried multiple plugins to optimize and speed up the site: WP Rocket, Perfmatters, WP Fastest Cache, WP Super Cache, WP-Optimize, Autoptimize, Asset CleanUp, etc.
But all of these plugins only added a small speed increase of about 5%. These of course did not singularly solve the problem.
Also, a more expensive hosting package was purchased with more powerful processing and RAM. Still slow to load, sadly.
Then I came across a plugin that, in the end, couldn’t solve the problem on its own. But it did help me find many problems that I could solve myself.
Let’s go into more detail…
Using Query Monitor as a Solution
The plugin Query Monitor is the developer tools panel for WordPress. It enables debugging of database queries, PHP errors, hooks and actions, block editor blocks, enqueued scripts and stylesheets, HTTP API calls, and more.
It includes some advanced features such as debugging of Ajax calls, REST API calls, and user capability checks. It also can narrow down much of its output by plugin or theme, allowing you to quickly determine poorly performing plugins, themes, or functions.
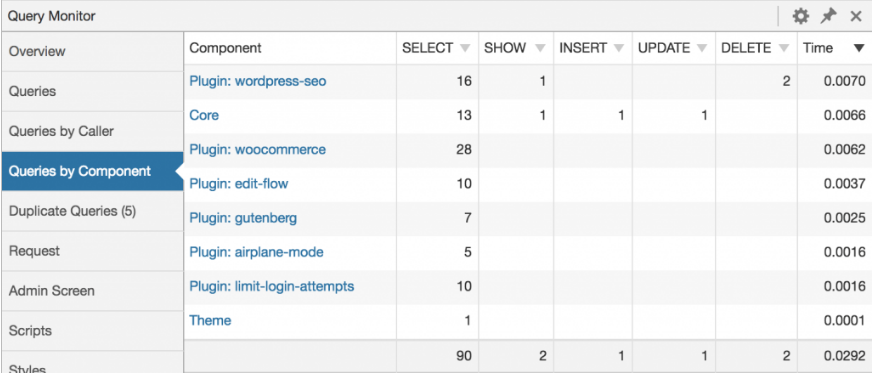
Query Monitor focuses heavily on presenting its information in a useful manner. For example, it can aggregate database queries grouped by the plugins, themes, or functions that are responsible for them.
It adds an admin toolbar menu showing an overview of the current page, with complete debugging information shown in panels once you select a menu item.
Here are some example screenshots:
Here’s an overview of what it shows for each page load:
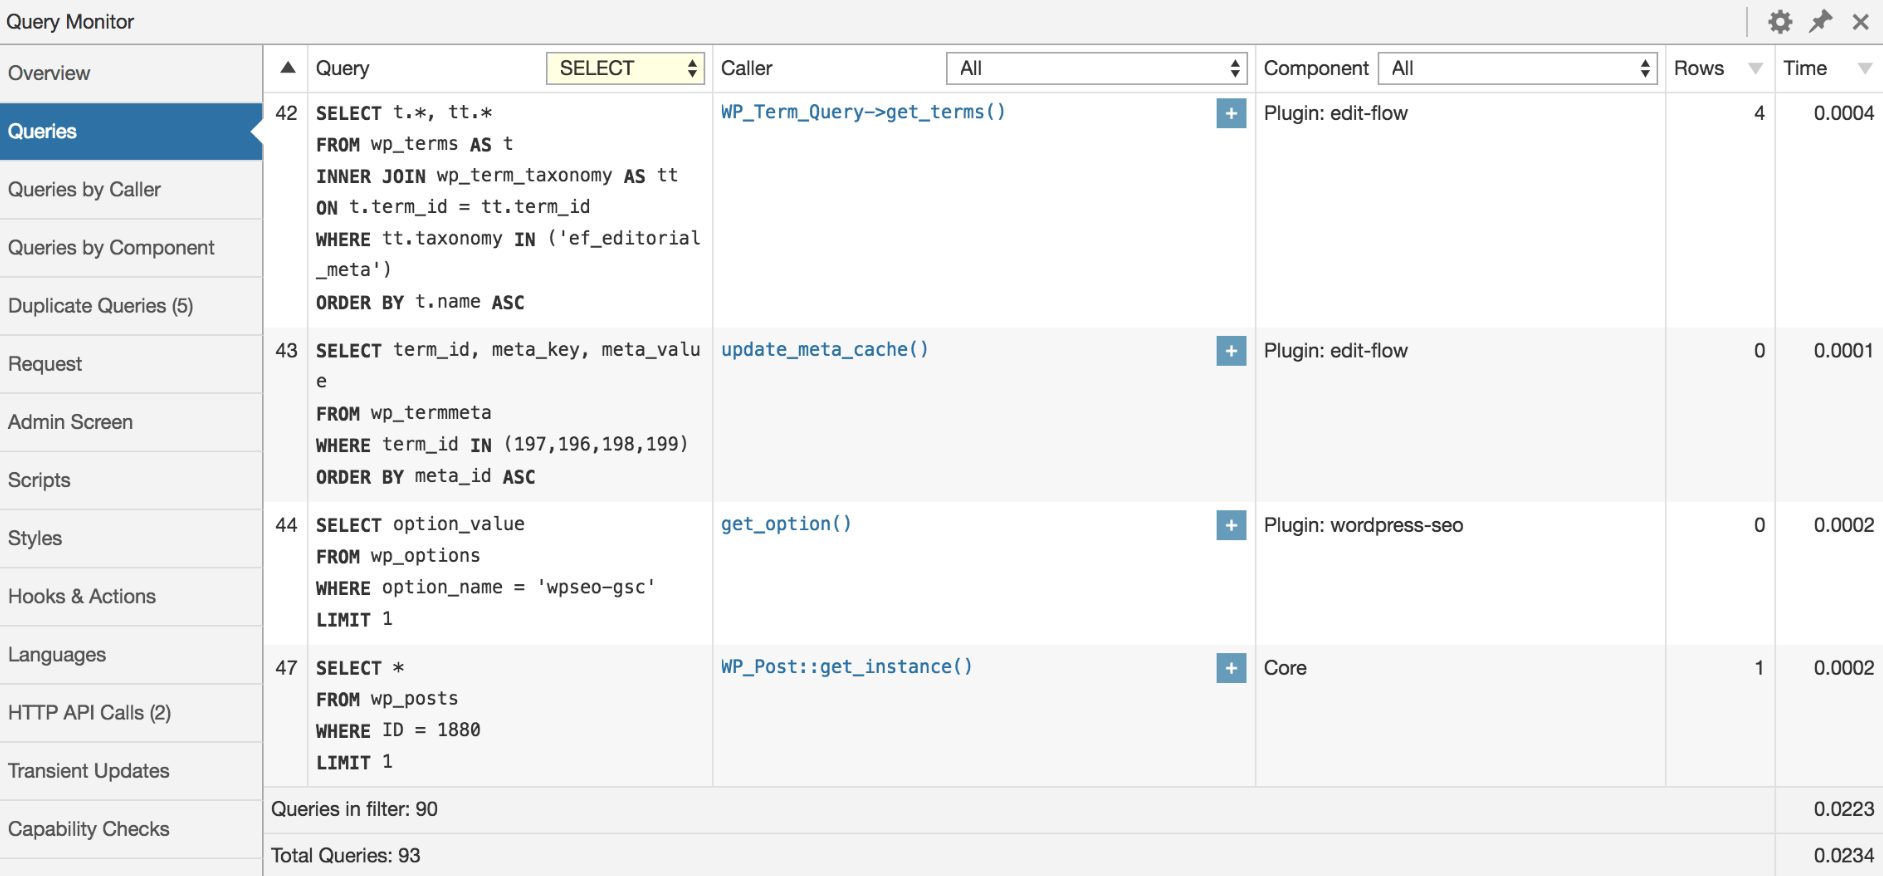
- Database queries, including notifications for slow, duplicate, or erroneous queries. Allows filtering by query type (SELECT, UPDATE, DELETE, etc), responsible component (plugin, theme, WordPress core), and calling function, and provides separate aggregate views for each.
- The template filename, the complete template hierarchy, and names of all template parts that were loaded or not loaded.
- PHP errors presented nicely along with their responsible component and call stack, and a visible warning in the admin toolbar.
- Blocks and associated properties in post content when using WordPress 5.0+ or the Gutenberg plugin.
- Matched rewrite rules, associated query strings, and query vars.
- Enqueued scripts and stylesheets, along with their dependencies, dependents, and alerts for broken dependencies.
- HTTP API requests, with response code, responsible component, and time taken, with alerts for failed or erroneous requests.
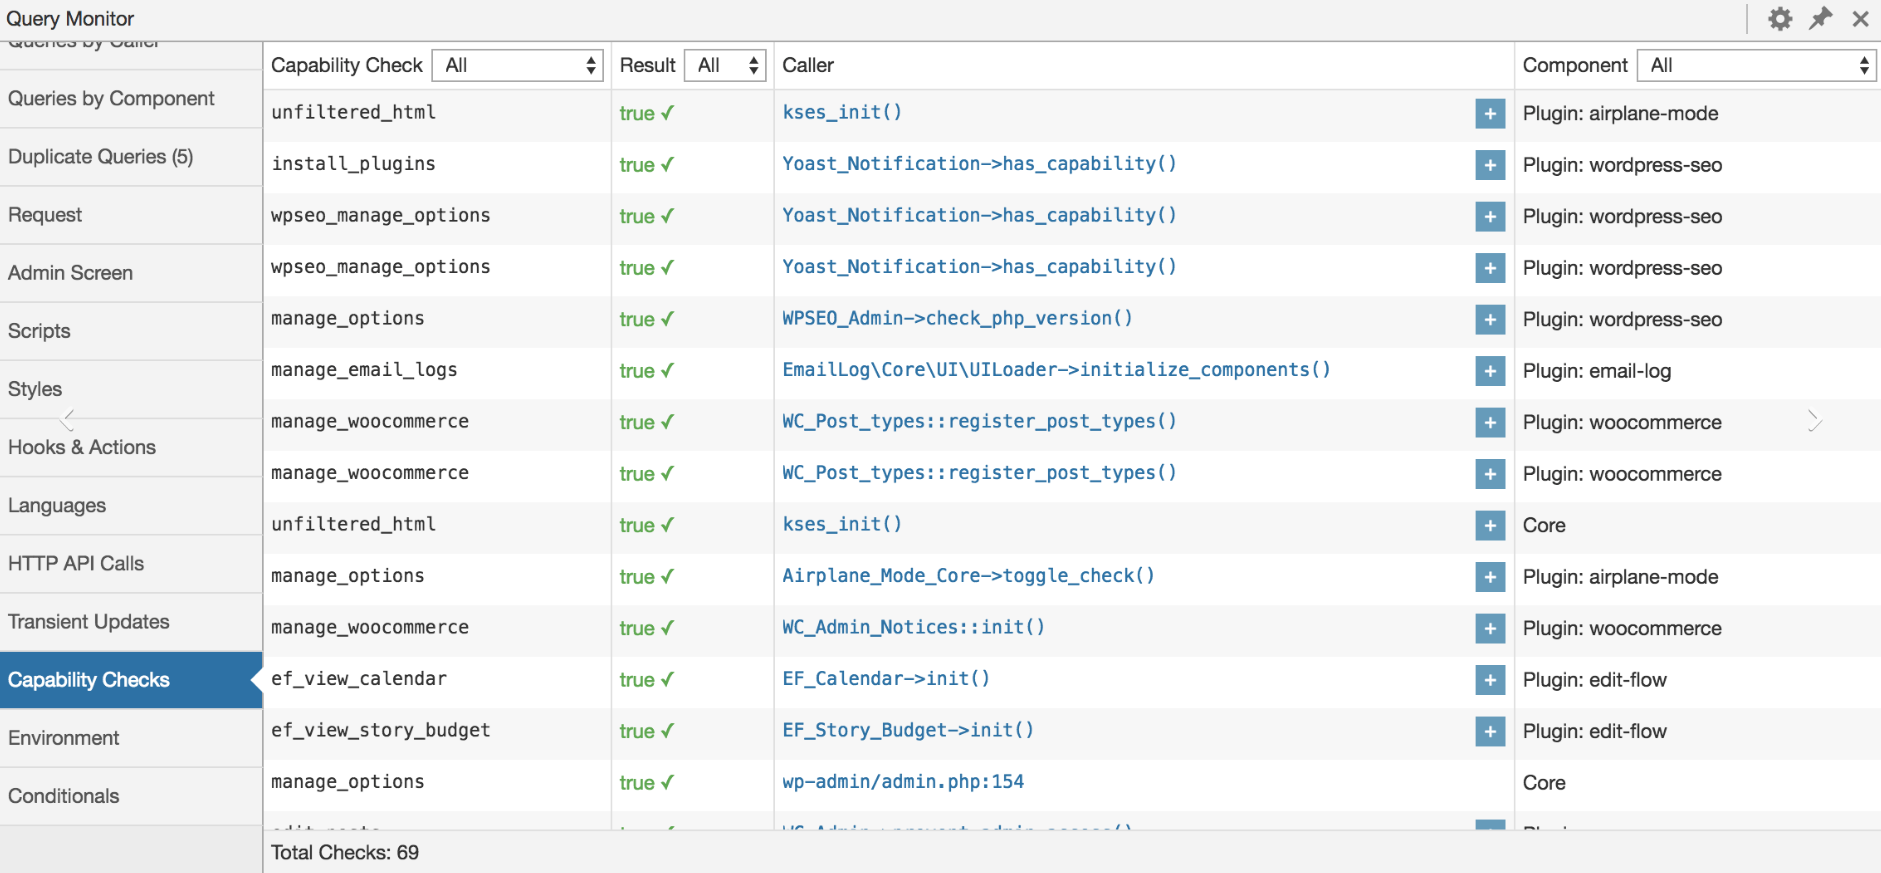
- User capability checks, along with the result and any parameters passed to the capability check.
- Environment information, including detailed information about PHP, the database, WordPress, and the web server.
- The values of all WordPress conditional functions such as is_single(), is_home(), etc.
- Transients that were updated.
As well as:
- Whenever a redirect occurs, Query Monitor adds an HTTP header containing the call stack. This allows you to use your HTTP inspector or browser developer tools to track what caused the redirect.
- The response from any Ajax request on the page will contain various debug information in its headers. PHP errors are also logged to the browser console.
- The response from an authenticated WordPress REST API request will contain various debug information in the headers if the authenticated user has permission to view the Query Monitor data.
This is just a godsend for any developer, isn’t it? You can easily track which plugin and which hook has slow requests, or how long your custom code takes to process.
In my case, I found a lot of incorrect custom code on the client’s site, left behind by the previous developers of the site which slowed down the site with a large number of records in the database. For example, multiple irrational use of custom queries to the database to prepare data, although one could do without them.
At the same time, in all requests, the data was selected all at once, and then they tried to filter them in php. Although immediately it was possible to receive only the necessary data and with this minimum в data it was already possible to work further.
Never give up!
With the help of this tool, I managed to return the previous site loading speed - about 300-500Ms instead of 30000Ms and increase the performance by 60-100 times!
Good luck, and never give up!